Linux Processes and Signals Cheatsheet
Syntax Styles
ps supports three styles of options that can be mixed but behave differently:
| Style | Syntax | Example |
|---|---|---|
| UNIX | Single dash | ps -ef |
| BSD | No dash | ps aux |
| GNU long | Double dash | ps --forest |
Mixing styles works but can change the output:
ps -fp 310,311prints the UNIX full format, whileps -fp 310 311treats the second PID as a BSD-style argument and the columns change (aSTATcolumn appears,TIMEgets shorter). Stick to one style per command when possible.
Reading the Output
Process I/O and Return Codes
A process takes standard input (STDIN) and returns:
- STDOUT (standard output): printed on your console
- STDERR (standard error): you see that too, unless you redirect it with
command 2> /dev/null - Return code:
0on success, a different number otherwise (echo $?shows the last one)
Some processes don’t read STDIN (they read files or data from the kernel), and some write nothing to STDOUT or STDERR. But every process returns a return code.
Signals
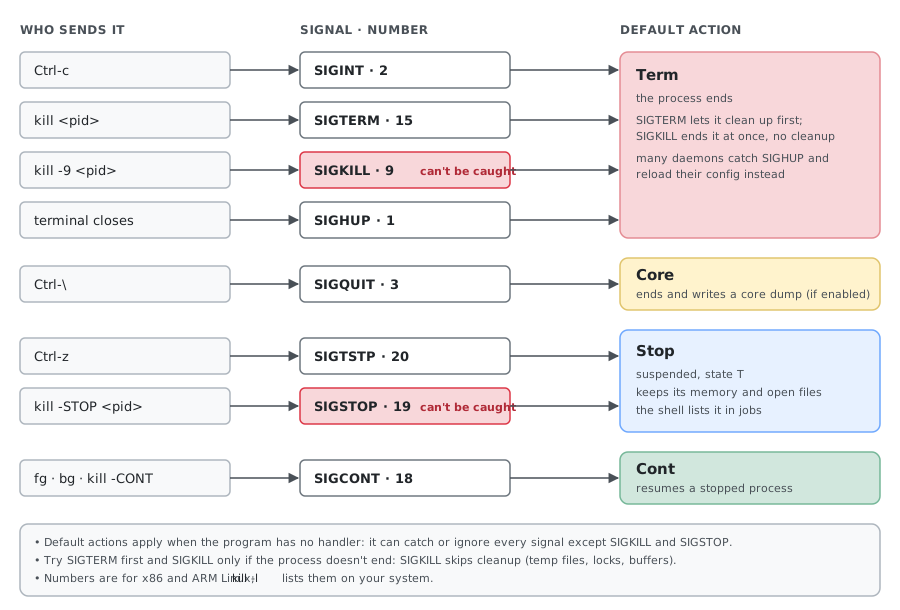
Each signal has a default action:
| Action | Description |
|---|---|
| Term | Terminate the process |
| Core | Save a memory image (core dump), then terminate |
| Stop | Stop (suspend) the process until it gets SIGCONT |
| Cont | Continue a stopped process |
| Ign | Ignore the signal (for example SIGCHLD) |
Programs can install handlers to ignore, replace or extend a signal’s default action, except for SIGKILL and SIGSTOP, which can’t be caught or ignored.
Common Signals
| Signal | Number | Default | Typical use |
|---|---|---|---|
SIGHUP | 1 | Term | Terminal closed; many daemons reload their config |
SIGINT | 2 | Term | Ctrl-c |
SIGQUIT | 3 | Core | Ctrl-\ |
SIGKILL | 9 | Term | Kill at once, can’t be caught |
SIGTERM | 15 | Term | Polite stop, the default of kill |
SIGCONT | 18 | Cont | Resume a stopped process (fg, bg) |
SIGSTOP | 19 | Stop | Stop, can’t be caught |
SIGTSTP | 20 | Stop | Ctrl-z |
Numbers are for x86 and ARM Linux; kill -l lists them on your system.
Sending Signals
The foreground process gets a signal from a keyboard shortcut:
| Shortcut | Signal | Action |
|---|---|---|
Ctrl-z | SIGTSTP | Suspend (stop) the process |
Ctrl-c | SIGINT | Interrupt (terminate) the process |
Ctrl-\ | SIGQUIT | Quit with a core dump |
Background processes, or processes in another session, need a command:
| Command | Description |
|---|---|
kill <pid> | Send SIGTERM |
kill -HUP <pid> | Send SIGHUP (reload for many daemons) |
kill -9 <pid> | Send SIGKILL (last resort) |
kill -l | List signal names and numbers |
pkill -f '<pattern>' | Signal every process whose command line matches |
killall nginx | Signal every process with that name (from psmisc) |
Process States
| State | Meaning |
|---|---|
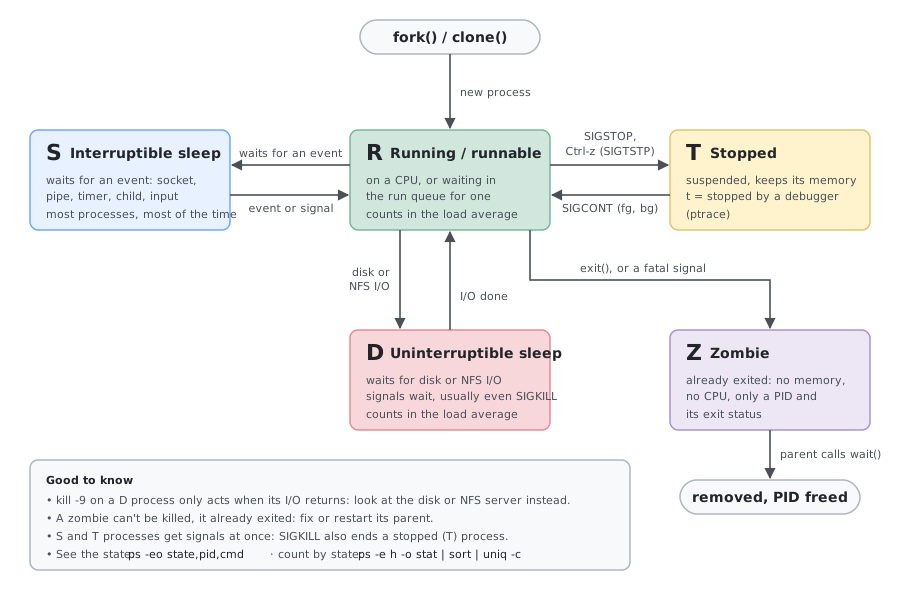
R | Running, or runnable in the run queue |
D | Uninterruptible sleep, waiting on I/O (usually disk); signals don’t interrupt it |
S | Interruptible sleep, waiting for an event |
T | Stopped by a signal (e.g. Ctrl-z) |
t | Stopped by a debugger while being traced |
Z | Zombie: finished, but the parent hasn’t read its exit code yet; it disappears once the parent calls wait |
I | Idle kernel thread |
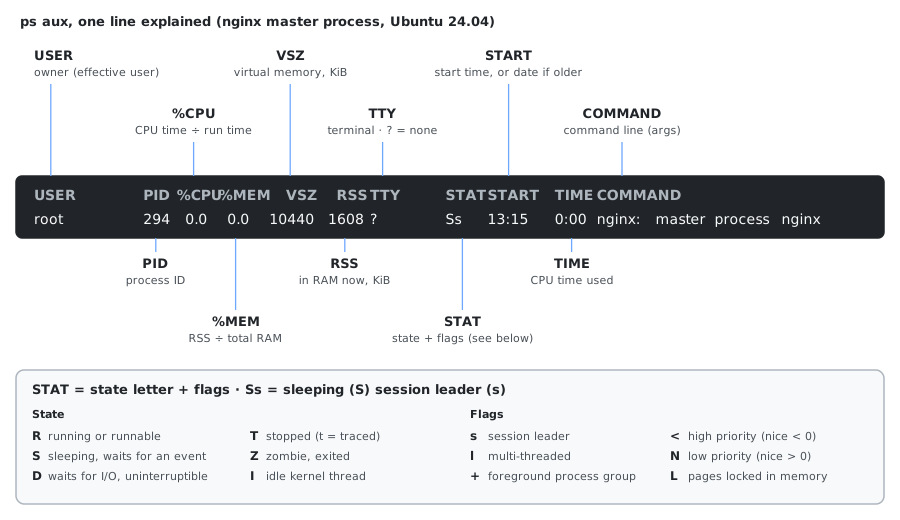
The stat column adds flags after the state, such as s (session leader), l (multi-threaded), + (foreground process group), < (high priority) and N (low priority).
| Command | Description |
|---|---|
ps -eo state,pid,cmd | grep "^R" | Running (also lists the ps itself) |
ps -eo state,pid,cmd | grep "^D" | Uninterruptible sleep, usually I/O |
ps -eo state,pid,cmd | grep "^S" | Sleeping |
ps -eo state,pid,cmd | grep "^T" | Stopped |
ps -eo state,pid,cmd | grep "^Z" | Zombies |
ps -e h -o stat | sort | uniq -c | sort -rn | Count processes by state and flags |
Load Average: R and D Processes
The load average counts tasks in R and D state, so these show what is behind a high load:
# Linux, per thread
ps -eLo state,pid,cmd | grep -E '^[DR]'
top -H -b -n1 | awk '$8=="R" || $8=="D"'

# Solaris: "O" (on a processor) and "R" (runnable) in the S column of ps -elf
ps -elf | awk '$2 ~ /O/ || $2 ~ /R/'
Solaris uses
Ofor a process currently on a processor andRfor runnable; Linux has no separateOstate, a running or runnable process is justR.
Watching for D Processes
# Every second for one minute
for i in $(seq 1 60); do ps -eo state,pid,cmd | grep "^D"; echo "--- $i ---"; sleep 1; done

# Or with watch
watch -n 1 "ps aux | awk '\$8 ~ /D/'"
Selecting Processes
| Command | Description |
|---|---|
ps -ef | All processes, full format (UNIX) |
ps aux | All processes with %CPU, %MEM, RSS (BSD) |
ps -eF | Extra full format, includes the PSR column (CPU the process runs on) |
ps -u username -o pid,%cpu,%mem,cmd | Processes of one user |
ps -C nginx | By command name |
ps -C sshd,nginx -o pid,cmd,%cpu | Several command names, custom columns |
ps -p 1234 | One PID |
ps -p 1,2,3 | Several PIDs |
ps -fp 1234 | Full format for a PID |
ps -fp "$(pgrep -d, nginx)" | Full format for every PID that pgrep finds |
ps -t pts/0 | Processes on one terminal (error if the terminal doesn’t exist) |
ps -t tty1,tty2 | Several terminals |
ps -eo tty,pid,cmd | grep "^?" | Processes without a controlling terminal (daemons) |
Finding PIDs
| Command | Description |
|---|---|
pidof nginx | PIDs of a program, by exact name |
pgrep nginx | PIDs whose process name matches a regex |
pgrep -a nginx | Same, with the full command line |
pgrep -af '<pattern>' | Match against the full command line |
pgrep -u www-data nginx | Only processes of one user |
pgrep and pkill never match themselves, unlike ps | grep or ps | awk.
Killing Processes
# Preview what matches, then kill it
pgrep -af '<pattern>'
pkill -f '<pattern>'           # SIGTERM
pkill -9 -f '<pattern>'        # SIGKILL, if SIGTERM didn't work

# A loop over PIDs: take them from pgrep
for pid in $(pgrep -f '<pattern>'); do kill "$pid"; done
Don’t build the PID list with
ps -ef | awk '/pattern/ {print $2}': theawk(and the shell running the loop) have the pattern in their own command line, so they match too and the loop kills itself.
Sorting and Top Lists
head -n 11 keeps the header plus ten processes.
| Command | Description |
|---|---|
ps -eo pid,comm,%mem,rss --sort=-rss | head -n 11 | Top 10 by memory (RSS) |
ps -eo %cpu,pid,user,cmd --sort=-%cpu | head -n 11 | Top 10 by CPU |
top -b -n1 | sed -n '7,17p' | Top 10 by CPU from top (header and ten lines) |
ps -ylC httpd --sort=rss | Apache processes by RSS, largest last (apache2 on Debian/Ubuntu) |
ps -ef --sort=start_time | By start time, oldest first |
ps -eo etime,pid,cmd --sort=-etime | head -n 11 | Running the longest |
ps -eo pid,etime,cputime,cmd --sort=-cputime | head -n 11 | Most CPU time used, with elapsed time |
ps -eo nlwp,pid,cmd --sort=-nlwp | head -n 11 | Most threads |
ps -eo pid,lstart,cmd | Full start date and time |
Filtering by Value
# More than 5% CPU (NR > 1 skips the header)
ps -eo %cpu,pid,cmd | awk 'NR > 1 && $1 > 5.0'

# Multi-threaded processes
ps -eo nlwp,pid,cmd | awk 'NR > 1 && $1 > 1' | sort -rn | head

# Count processes by user
ps -eo user= | sort | uniq -c | sort -rn
ps -ef | awk '{print $1}' would also count the UID header, and ps -ef shows a numeric UID for user names longer than 8 characters; user= avoids both.
Open File Descriptors per Process
sudo ls -d /proc/[1-9]*/fd/* 2>/dev/null | sed 's/\/fd.*$//' | uniq -c | sort -rn | head
Without sudo you only see your own processes.
Process Tree
| Command | Description |
|---|---|
ps -ef --forest | Full tree, UNIX format |
ps -Hwfe | Tree by indentation |
ps axf | Tree with STAT, BSD format |
ps -e -o pid,nlwp,cmd --forest | Tree with the number of threads |
pstree -s 1234 | Parents of one process |
pstree -p | With PIDs |
pstree -u | Show user changes (when the UID changes) |
pstree -a | With command-line arguments |
Threads
| Command | Description |
|---|---|
ps -Lp <pid> | Threads of one process (LWP = thread ID) |
ps -eLf | All threads, with LWP and NLWP (thread count) |
ps -C httpd -L -o pid,tid,cmd,%cpu | Threads of a command, custom columns |
top -H -p <pid> | Live per-thread CPU usage |
Other Columns
| Command | Description |
|---|---|
ps -eo pid,comm | Only PID and process name |
ps -eo pid,ni,cmd | Nice value |
ps -eo pid,cgroup,cmd | Control group (systemd unit, container) |
ps -eZ | Security context: SELinux on RHEL, AppArmor profile on Ubuntu |
Wide Output
-w widens the output; a second -w removes the width limit, so long command lines aren’t truncated:
| Command | Description |
|---|---|
ps -efww | All processes, untruncated |
ps auxww | Same, BSD format |
ps -fww -p 1234 | Untruncated command line of one PID |
ps -ww -o args= -p 1234 | Only the command line |
ps -ww -p 1234 alone isn’t enough: its default columns show only the process name, not the arguments.
Scripting
| Command | Description |
|---|---|
ps aux --no-headers | No header line |
ps -eo pid,cmd --no-headers | wc -l | Count processes |
ps -C apache2 -o pid= | Only the PIDs (pid= gives an empty header) |
Check Whether a PID Is Running
if ps -p "$PID" > /dev/null; then
    echo "Process $PID is running"
else
    echo "Process $PID is not running"
fi
Export the Process List to CSV
ps -eo pid=,user=,%cpu=,%mem=,comm= | awk -v OFS=, '{$1=$1; print}' > processes.csv
comm (the process name) has no spaces in practice; a full command line (cmd) would, and every space would become a new CSV field.
Continuous Monitoring with watch
# Top memory consumers, refreshed every 2 seconds
watch -n 2 'ps aux --sort=-%mem | head -20'

# One program
watch -n 1 'ps -p "$(pgrep -d, nginx)" -o pid,ppid,%cpu,%mem,cmd'

# R and D processes
watch -n 1 'ps -eo state,pid,cmd | grep "^[DR]"'
Useful One-Liners
Memory
# Total RSS of all processes of one program
ps -C nginx -o rss= | awk '{s+=$1} END {print s/1024 " MiB"}'

# RSS summed by program name: who uses the RAM
ps -eo rss=,comm= | awk '{m[$2]+=$1} END {for (c in m) printf "%8.1f MiB %s\n", m[c]/1024, c}' | sort -rn | head

# Swap used per process, in KiB (ps has no swap column)
awk '/^Name/ {n=$2} /^VmSwap/ {print $2, n}' /proc/[0-9]*/status | sort -rn | head
RSS counts shared memory (libraries, shared buffers) in every process that maps it, so a sum over many processes is higher than the memory really used.
Zombies and Parents
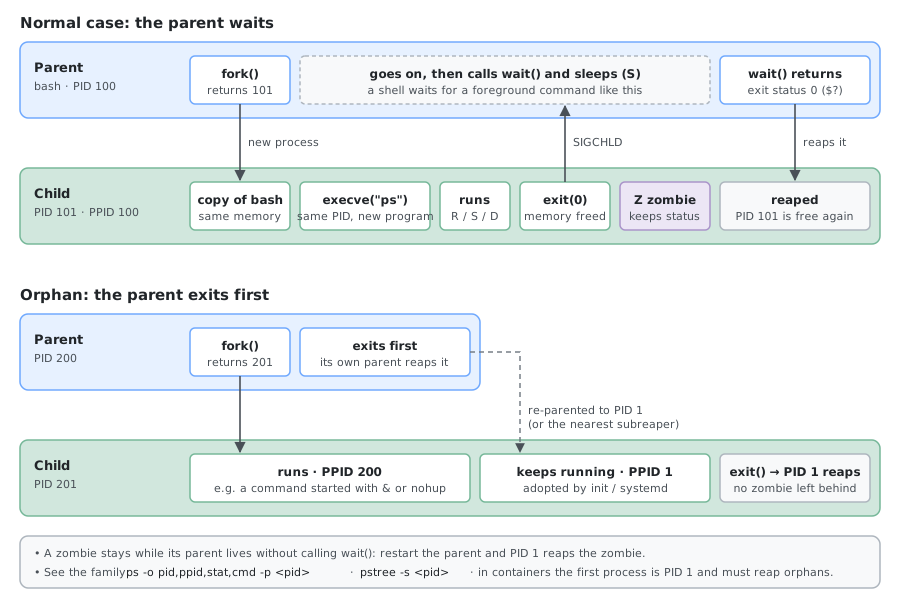
| Command | Description |
|---|---|
ps -eo stat=,pid=,ppid=,cmd= | awk '$1 ~ /^Z/' | Zombies with their parent PID |
ps -o ppid= -p <pid> | Parent of a process |
ps -fp "$(ps -o ppid= -p <pid> | tr -d ' ')" | Details of the parent |
A zombie can’t be killed: it has already exited. Its parent has to read its exit status, so fix or restart the parent; if the parent dies, init (PID 1) adopts the zombie and reaps it.
Inspecting One Process
| Command | Description |
|---|---|
ls -l /proc/<pid>/cwd /proc/<pid>/exe | Working directory and binary |
lsof -p <pid> | Open files, sockets and libraries |
tr '\0' '\n' < /proc/<pid>/environ | Environment the process started with |
cat /proc/<pid>/limits | Limits, e.g. Max open files for “Too many open files” |
ps -eo state,pid,wchan:32,cmd | awk '$1=="D"' | Kernel function each D process waits in |
sudo ss -ltnp 'sport = :80' | Process listening on port 80 |
Reading another user’s /proc/<pid> files needs sudo. environ shows the environment at start-up, not later changes, and programs that rewrite their process title (nginx, PostgreSQL) overwrite it.
Waiting and Bulk Signals
# Wait until a process ends (kill -0 sends nothing, it only checks that the PID exists)
while kill -0 <pid> 2>/dev/null; do sleep 1; done

# Everything of one user: preview, then stop it
pgrep -au username
pkill -u username
kill -0 also fails for a process of another user (no permission); in that case use ps -p <pid> > /dev/null as the test.
Priority
| Command | Description |
|---|---|
renice -n 10 -p <pid> | Lower the CPU priority of a running process |
ionice -c3 -p <pid> | Disk I/O only when the disk is idle |
ionice -p <pid> | Show the I/O class |
nice -n 10 command | Start a command with lower CPU priority |
Only root can raise the priority again (a lower nice value).
Format Specifier Reference
Quick lookup for -o / --format fields. Add = after a field (pid=) to drop its header.
Process Identity
| Specifier | Description |
|---|---|
pid | Process ID |
ppid | Parent process ID |
pgid | Process group ID |
sid | Session ID |
tid | Thread ID (same as lwp, spid) |
tgid | Thread group ID (the PID of the process) |
nlwp | Number of threads (lightweight processes) |
User/Ownership
| Specifier | Description |
|---|---|
user | Effective user name |
uid | Effective user ID |
ruser | Real user name |
ruid | Real user ID |
group | Effective group name |
gid | Effective group ID |
CPU/Memory
| Specifier | Description |
|---|---|
%cpu | CPU usage: CPU time divided by run time, not an instant value |
%mem | Share of physical memory (RSS) |
pmem | Same as %mem |
rss | Resident set size (physical memory, KiB) |
vsz | Virtual memory size (KiB) |
sz | Size of the core image in physical pages |
maj_flt | Major page faults |
min_flt | Minor page faults |
Priority/Scheduling
| Specifier | Description |
|---|---|
pri | Priority: a higher number means a higher priority (ps -l shows PRI on another scale, where higher means lower) |
ni | Nice value (-20 to 19) |
rtprio | Real-time priority |
cls / class | Scheduling class (TS, FF, RR, B, IDL, DLN) |
psr | CPU the process last ran on |
State/Time
| Specifier | Description |
|---|---|
stat | State with flags (Ss, Sl+) |
s / state | State only, one character |
time | Cumulative CPU time |
cputime | Same as time |
etime | Elapsed time since start |
start | Start time (short format) |
lstart | Start time (full date) |
Command
| Specifier | Description |
|---|---|
args | Full command line with arguments |
cmd | Same as args |
comm | Command name only, without arguments |
Columns are cut at the terminal width; use -ww for the full command line.
Example Combining Specifiers
ps -eo pid,ppid,user,ni,%cpu,%mem,rss,etime,cmd --sort=-%mem | head -20
Comments